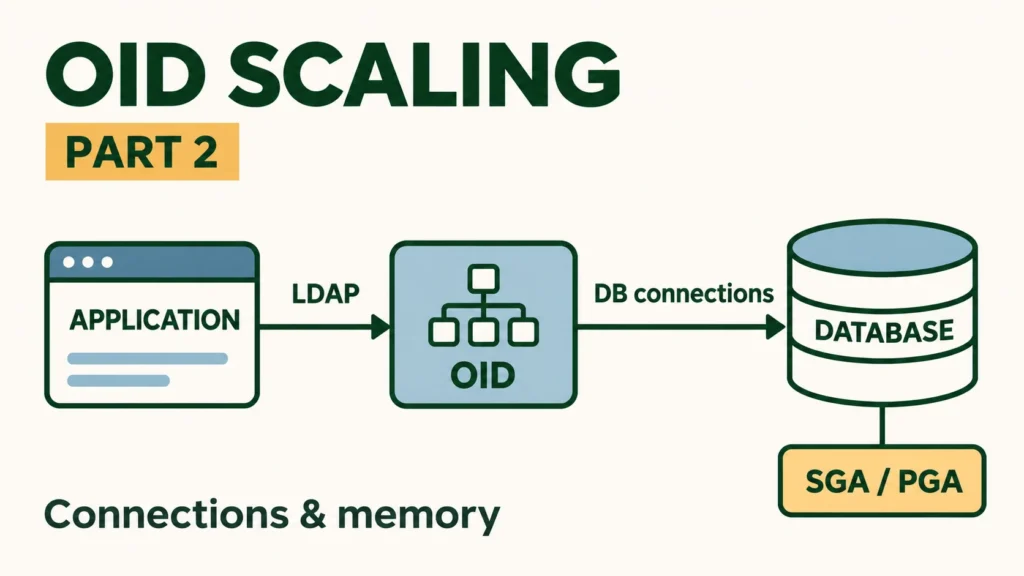
Before adding memory or increasing connection limits, find where OID requests are waiting. An application waiting for an LDAP connection needs a different investigation from OID waiting for its database. Increasing concurrency without finding the bottleneck can send more work to an already busy database.
This guide walks through slow logins and directory searches: identify the request path, read the relevant measurements, and then decide whether connection limits, memory, or server placement need to change.
Separate the parts of the request path
Oracle Internet Directory (OID) serves account and group information over LDAP, the protocol applications use for directory searches and authentication requests. OID stores directory data in Oracle Database.
For example, a portal sends a login request to OID. OID performs the database work it needs and returns a result. The following is a simplified troubleshooting path; caching and deployment details can change the individual steps.
- Application to OID: measure the wait for an LDAP connection separately from the request’s response time.
- OID to database: examine OID process load, database connection use, and waits for database work.
- Hosts and network: check memory, CPU, I/O, and latency between servers.
A connection pool keeps connections available for reuse instead of opening one for every request. The application’s LDAP pool and OID’s database connections serve different parts of the path. If applications or management tools run in WebLogic, examine those JVMs separately. A WebLogic thread count does not describe OID’s LDAP processing capacity.
When every connection is in use, another request may wait for one to return. Check whether the pool is too small for legitimate demand or whether work is holding connections for too long. In the latter case, investigate slow work and connection returns before enlarging the pool.
Record the slow operation and its time window
Establish whether the problem affects logins, searches, or bulk updates. If logins work normally but broad searches are slow, investigate search scope and filters before raising every connection limit.
Collect request volume, response times, errors, timeouts, and OID/database logs for the same period. Include p95 when available: 95% of measured requests finished within that time. An average can hide a smaller group of very slow requests. Compare changes using the same operation mix, load, and measurement window.
Compare database usage with the actual limit
The following read-only query uses Oracle Database 19c views and requires approved access. Ask the DBA for the results if your account lacks permission. For RAC, inspect each instance; one instance’s figures are not cluster-wide totals.
SELECT resource_name, current_utilization,
       max_utilization, limit_value
FROM v$resource_limit
WHERE resource_name IN ('processes', 'sessions');
CURRENT_UTILIZATION is current usage. MAX_UTILIZATION is the highest usage since the instance started. Compare current usage with LIMIT_VALUE to assess headroom. Current usage of 450 and a historical peak of 500 do not establish 90% utilization of the configured limit: the limit is missing. Calculate a percentage only when that limit is numeric; handle values such as UNLIMITED separately. V$RESOURCE_LIMIT reference
If usage approaches the limit at the same time connection errors occur, identify which processes are creating connections. Fix connections that are not returned or work that holds them too long before treating the limit as the cause. Consider additional capacity when legitimate demand has increased and the database has room to process it.
PROCESSES limits database processes, not the number of people logging in. Allow for background work too. SESSIONS limits sessions. The 19c derived default is (1.5 × PROCESSES) + 22; setting PROCESSES to 500 does not make 750 a universal session recommendation. Check the effective settings and container-specific rules. PROCESSES · SESSIONS
Check what each OID setting controls
| Setting | What to check |
|---|---|
orclmaxcc |
Database connections for an OID server process; distinguish these from application LDAP connections. |
orclserverprocs |
OID LDAP server process count. Check whether CPU and database capacity can support more concurrent work. |
orclldapconntimeout |
Idle LDAP connection timeout. In the 14.1.2 guide, 60 means 60 minutes. Users configured for statistics tracking are exempt. |
Oracle’s 14.1.2 tuning guide suggests 10 for orclmaxcc and a process count based on CPU cores. These are not proof of the best values for a particular workload. If database waits or LDAP latency increase after a change, adding concurrency has not helped. Changing orclmaxcc also requires a server restart. OID tuning guide, Chapter 10
Select the correct OID instance before recording these settings in the management interface. If using LDAP tools, use a read procedure appropriate to the installed version and instance DN. An LDIF containing changetype: modify requests a configuration change; it is not a query.
Check host headroom before increasing the SGA
The SGA is memory shared by Oracle Database processes. The PGA is separate memory used for database process work. OID and the operating system need memory too when they share the host. A server with 32GB of RAM therefore does not automatically have 24GB available for the SGA.
free -m
vmstat 1 5
On Linux, start with the available column in free. The free column shows unused memory; available estimates usable headroom, including reclaimable cache. For example, free 1000 and available 7000 do not mean only 1GB remains available. The -m option reports MiB. free command reference
Investigate memory pressure when available memory keeps falling while swap activity and request latency rise. A low free value alone, with normal service response, does not establish a need for more RAM. For CPU, examine which processes are busy and for how long, not just a single overall percentage.
SELECT name, display_value, issys_modifiable
FROM v$parameter
WHERE name IN ('memory_target', 'memory_max_target',
               'sga_target', 'sga_max_size',
               'db_cache_size', 'shared_pool_size',
               'pga_aggregate_target', 'processes', 'sessions');
This query shows the memory management settings currently in use. Under automatic SGA management, explicit DB_CACHE_SIZE and SHARED_POOL_SIZE settings can act as minimum sizes. Large minimums leave less room for automatic resizing. SGA_TARGET · DB_CACHE_SIZE
Evaluate database reads and waits alongside LDAP response times and available RAM. If increasing the SGA does not improve response times, investigate other causes, such as connection waits or expensive searches.
Plan when a setting takes effect and how to roll it back
In Oracle Database 19c, SGA_MAX_SIZE and PROCESSES cannot be changed immediately in the running instance. When using an SPFILE, plan the next-start settings and the restart procedure. Saving a value with SCOPE=SPFILE does not change the current runtime value. SGA_MAX_SIZE reference
The rules for changing SESSIONS differ between a non-CDB or CDB root and a PDB. SGA_TARGET also depends on the memory management mode and its limits. Confirm the scope with the DBA before adapting an ALTER SYSTEM command from another environment.
Change one setting at a time in a test environment under comparable load. Stop the test and restore the previous setting if timeouts or latency worsen. A parameter that needs a restart to apply may need another restart to roll back; include that in the maintenance plan.
Consider separate hosts when resource contention is evident
Separating OID and the database may help when they compete for CPU or memory on the same host. It also adds a network path between them. Compare LDAP latency, database waits, and network latency and retransmissions under equivalent load before and after the move.
When adding a node, test how connections move when a node fails, as well as normal throughput. Confirm the supported database, OS, JDK, and patch combination and licensing before deployment. The documentation versions used here do not certify a particular installed combination.
Choose the change from the evidence
- Identify the slow operation and time window, then align application, OID, and database logs.
- Distinguish an exhausted database limit from connections held too long or slow operations.
- If memory pressure is evident, review each host’s budget and the database memory management mode.
- Define the value, restart requirements, and rollback procedure; test one change at a time.
- Compare response times, throughput, and errors at the same load before approving a production change.
Documentation and evidence
Reviewed on November 5, 2026 against the Oracle Fusion Middleware 14.1.2 tuning guide and Oracle Database 19c parameter references. These references do not establish certification for a particular OID/database combination. The original installation’s patch level and underlying measurements were unavailable, so this guide does not claim a verified customer performance improvement. Numeric examples explain how to interpret settings. No commands were executed against a production database or OID instance during this review.


