
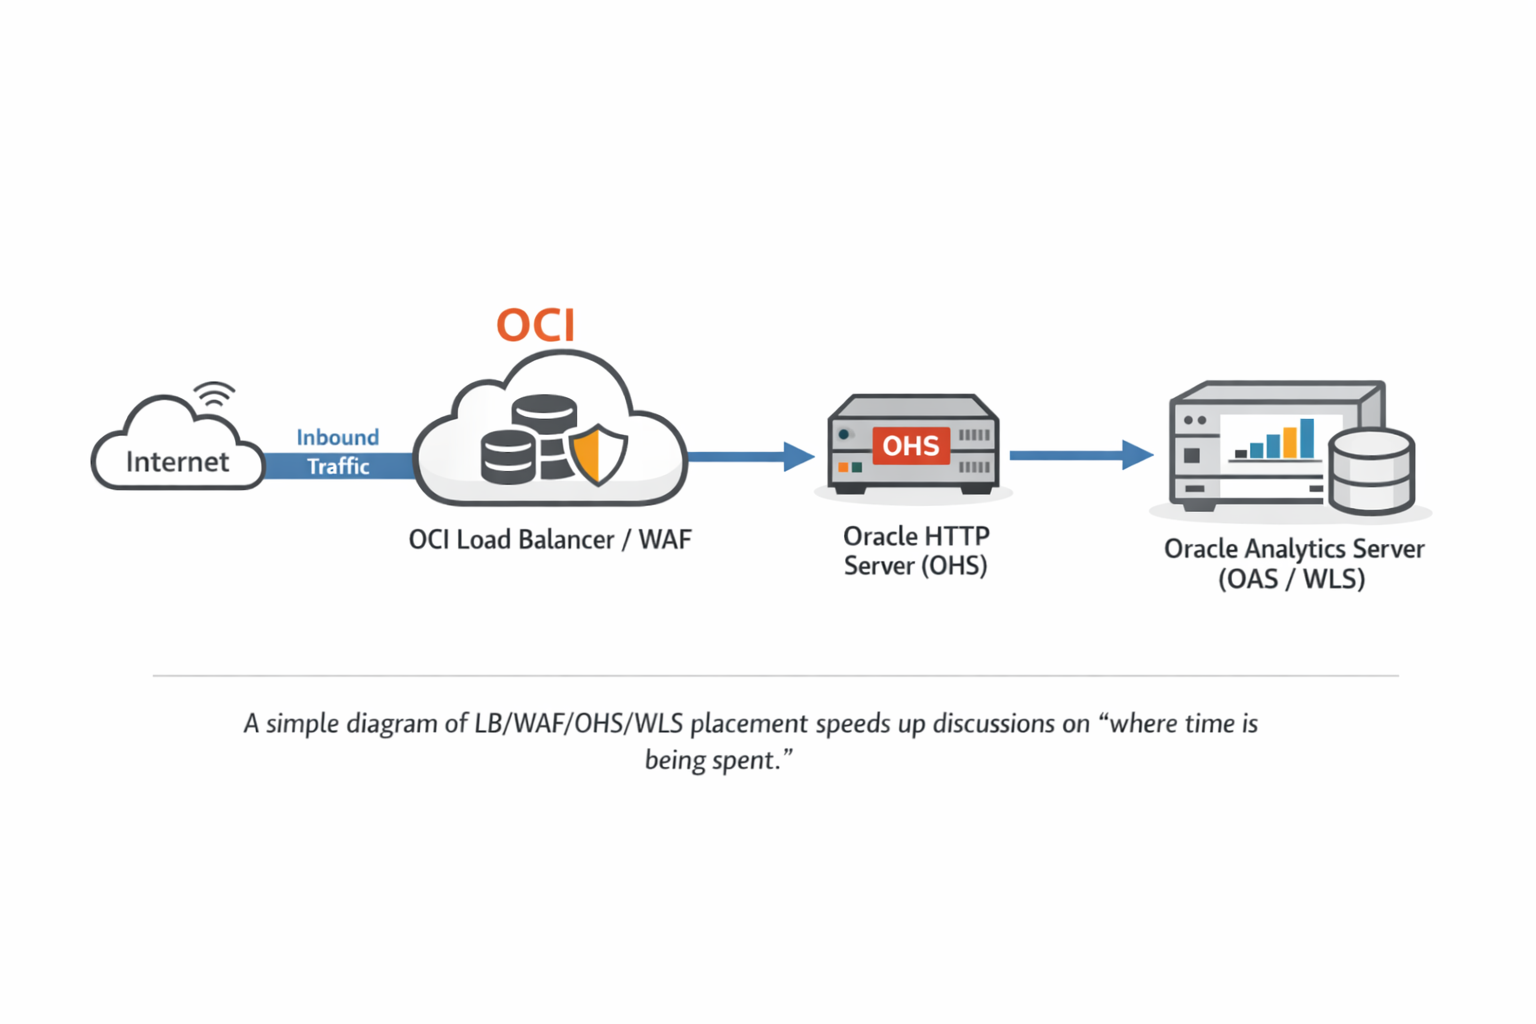
Right after a migration, when users say “sign-in is slow and dashboards are slow,” the first instinct is often to blame server sizing (CPU/memory/storage). Resource constraints can absolutely be the root cause in some cases, but when the perceived latency increases immediately after moving to OCI, the usual culprits are frequently configuration differences across: the traffic path (Load Balancer/WAF/OHS), the authentication path (AD/LDAP), and the DB/network path. These differences can dominate real-world user experience even when compute resources look sufficient.
This post does not try to provide a single “correct answer.” The goal is to help you move faster through the most time-consuming part: classification and initial analysis. If you split the symptom into sign-in latency and dashboard loading latency, and collect the minimum evidence needed for each track, your investigation becomes far more efficient—especially in environments where backend bypass tests are not feasible.
- When: Since the migration? Or since a later change (auth/network/patch/config)?
- Who: Everyone / a specific user group (admins only, external users only) / a specific account type?
- Where: Sign-in step / dashboard load (query execution) step / both?
Sign-in delay and dashboard delay can be related, but in practice they are often driven by different root causes (authentication vs query/DB). If you try to solve both as one problem, the hypothesis set becomes too large and you spend time without proving anything. If you split into a Sign-In track and a Dashboard/Query track, the required evidence and ownership become clear, and collaboration with security/network/DBA teams becomes much faster.
1) Pattern framing: the “three-sentence” scope reduction
Most real incidents start with a one-liner: “Login is slow” or “Dashboards are slow.” Before increasing log levels, restarting services, or blaming infrastructure, fill these three statements first—this is usually the highest ROI step.
- When: When did it become slow? (immediately after OCI migration vs after a later change)
- Who: Which users are affected? (all users vs a subset vs a specific account type)
- Where: Which phase is slow? (sign-in vs dashboard load vs both)
Once these are answered, the priority order becomes natural. For example, if “all users are slow at sign-in,” authentication/session initialization and the Front Door path move to the top. If sign-in is normal but a specific dashboard is slow, you should pivot to the query/DB track early.
| Item | On-Prem (before) | OCI (after) | Meaning (priority hint) |
|---|---|---|---|
| Sign-in time | e.g., 5–10s | e.g., 30s to minutes | Authentication / session init / Front Door (LB/WAF/OHS) rises |
| Dashboard load | e.g., seconds | e.g., tens of seconds to minutes | DB/query/network/connection pool/cache candidates are added |
| Blast radius | — | all users / some / specific dashboards | Distinguish “shared components” vs “specific resources” |
| Start time | — | right after OCI move | Migration config deltas (SSL/network/auth) are key clues |
- User-perceived: Use a stopwatch to measure “click Sign In → fully loaded UI” (repeat 3 times).
- Server-side: Preserve logs in the same time window (timestamps / ECID) to enable correlation.
Without numbers (seconds), you cannot objectively prove improvement after changing timeouts, cache, or provider settings.
2) Triage when backend bypass is not allowed
The cleanest test is “bypass LB/WAF and repeat the same scenario.” In many environments, security policies do not allow that. That does not mean you cannot triage. If bypass is not possible, the Front Door configuration (LB/WAF/OHS) becomes an even stronger candidate and deserves early attention.
In non-bypass environments, reduce variables by walking these three axes:
- Front Door axis: SSL termination point, timeouts, keep-alive, header forwarding, sticky sessions
- Authentication/Middleware axis: provider chain behavior, LDAP/AD connection and search latency
- Query/DB axis: isolate Physical SQL and validate with execution plans and DB-side waits
3) What to collect: preserve “evidence” with the smallest useful set
3-1. Pin the patch level (mandatory baseline)
Performance investigations often get derailed because multiple “similar-looking” issues overlap. Right after a migration, software level (patch bundle/PSU) and configuration (auth/network/proxy) often change at the same time. Your first step should be to capture the OPatch inventory to lock the baseline.
cd $ORACLE_HOME/OPatch
./opatch version
./opatch lsinventory -detail > /tmp/opatch_lsinventory_detail_$(hostname)_$(date +%F).txt
This output is not “just for reference.” It is your audit trail. If performance improves after you change timeouts or provider settings, you still need to separate “config effect” vs “patch effect.” Baseline data makes that possible.
3-2. Front Door (LB/WAF/OHS): commonly missed tuning points
One of the most common OCI migration deltas is where TLS is terminated. If TLS terminates at the LB, backend traffic might be HTTP. If you keep end-to-end TLS, OHS/WLS sees TLS directly. There is no universal “right” choice, but a change here often affects: connection reuse (keep-alive), idle/backend timeouts, and header processing—all of which can dominate perceived latency.
- Timeout alignment: Confirm how client/backend/idle timeouts are set and aligned across LB/WAF/OHS.
- Keep-Alive: If connections are recreated per request, both sign-in and dashboards can become noticeably slower.
- Sticky session: Check whether post-login requests are spread across nodes causing repeated session/auth work.
- Proxy headers: Validate Host and X-Forwarded-* behavior matches what OHS/WLS expects in your design.
A single query or a specific permission issue usually impacts only a subset of users or dashboards. If all users experience slow sign-in and slow dashboards, time is likely being consumed in shared paths: Front Door, shared auth flows, or shared DB/network paths. In non-bypass environments, prioritizing Front Door deltas is often the fastest path to clarity.
3-3. Authentication (AD/LDAP): confirm first, do not conclude from a single dump
If sign-in time grows significantly, you should check whether user/group lookups are delayed. However, seeing LDAP-related threads in a thread dump does not prove LDAP is the root cause. LDAP threads can be “normally waiting,” while the real bottleneck is elsewhere (Front Door, DB, internal cache).
- Confirm the Authentication Provider chain and which providers are actually invoked during OAS login.
- Identify whether the LDAP endpoints observed in dumps are intended (treat unexpected routing/referrals as “needs validation”).
- Verify timeouts: not only connect timeout, but whether LDAP search/read/response timeouts exist and how they are configured.
- Review Follow Referrals: enable only when required; confirm whether it expands to additional endpoints.
If LDAP threads repeatedly show the stack pattern below, they may be waiting on network responses. Note that Java thread state may appear RUNNABLE even while the thread is effectively blocked in a native socket read (e.g., socketRead0). The critical proof is whether this wait blocks the request-handling (business) threads serving your login.
- java.net.SocketInputStream.socketRead0
- java.io.BufferedInputStream.read / fill
- netscape.ldap.ber.stream.BERElement.getElement
- netscape.ldap.LDAPConnThread.run
If possible, capture the ExecuteThread (or request thread) handling the login request in the same time window. If you can show the request thread waiting inside the LDAP authentication path, cross-team collaboration (network/AD/LDAP) becomes much faster.
PID=<bi_server1_pid>
jcmd $PID Thread.print > /tmp/bi_server1_td_1.txt
sleep 10
jcmd $PID Thread.print > /tmp/bi_server1_td_2.txt
sleep 10
jcmd $PID Thread.print > /tmp/bi_server1_td_3.txt
4) Slow dashboards: when to pivot to the Query/DB track
If sign-in is normal but dashboard loading is slow, pivot away from “authentication” and focus on “query/DB.” A common mistake is to keep hunting in WebLogic/Front Door while the actual bottleneck is an expensive Physical SQL query. Ultimately, dashboard delay must be narrowed to: which Physical SQL runs and how long it takes.
Practically, the flow is:
- Reproduce the slowness and identify which queries run during the slow window.
- Validate the Physical SQL on the DB side: execution plan, waits, index usage, and resource consumption.
- If it is slow only in OCI, compare DB placement, network path, and session/environment differences with On-Prem.
Fixing sign-in does not guarantee dashboards will be fast, and tuning one dashboard query does not automatically improve sign-in. Keep the two tracks separate, and prove each with its own evidence.
5) Wrap-up: a minimal checklist for higher-quality triage
- Baseline: capture OPatch inventory to lock patch/version baseline
- Split: sign-in vs dashboard; all users vs subset; confirm the exact scope
- Front Door: review timeouts / keep-alive / sticky sessions / header forwarding
- Authentication: provider chain + endpoint identification + connect/read/search timeout existence/values + referral behavior
- Query: for dashboard slowness, pivot to Physical SQL + DB execution plan
 to MySQL in 2025: A Comprehensive Guide 3")